


I ran InstaMapper for the duration of the ride on my iPhone, resulting in the following track:
GPS tracking powered by InstaMapper.com
Direct link to track.
I ran InstaMapper for the duration of the ride on my iPhone, resulting in the following track:
GPS tracking powered by InstaMapper.com
Direct link to track.
I host my own mail server (Courier with Spamassassin) and check my mail via IMAP on my iPhone. Unfortunately Apple never implemented use of the IDLE command to enable Push with an IMAP account (there is a jailbroken app that will do this!), so the alternative (if one is desperate for Push) is to pipe their email to a service that is supported (Yahoo, and now apparently Gmail), or set up Microsoft Exchange. Me, being me, I decided to try something new, and set about setting up Exchange. The first step, of course, is installing Windows Server (I decided to do a fresh install of 2008 Datacenter Edition), setting up a domain controller/forest/domain, and then Exchange, which I actually installed on another machine that runs Windows Server 2003 R2. The only issue is that Microsoft has not release a supported version of Exchange Server 2007 for 32-bit x86 machines! The only option is their 64-bit build, and as I don’t have any 64-bit server machines (my servers are a tad old) I had to make do with Exchange 2003 with Service Pack 2 (SP2 includes the additional functionality to enable Push, specifically ActiveSync).
After it all appeared to be installed and happy, my iPhone would not beep, no matter how many emails I sent myself. As it turns out, the entire time (of course) it was connected to my WiFi network. As soon as I disabled WiFi on the device, and it connected to my server via the 3G network, I noticed the “IP-AUTD Initialized” message in the server’s event log. Hurrah!
The reason? Have a look at point #2 in: iPhone 2.0 software: Troubleshooting iPhone or iPod touch Exchange ActiveSync “Push” issues (thank you very much to Tonicwater, see below). Perhaps the iPhone could check for a network environment change (i.e. logging on a WiFi network) and flush the DNS cache – at least for mail/corporate-related activities, such as the address of one’s registered Exchange servers. Then they would always be current, and the ‘push’ process could be re-initiated with the same server at its newfound address.
The final step was to forward mail from my Linux mail server to Exchange. This was accomplished by adding the following code to the end of Courier’s maildroprc file:
if ($LOGNAME eq "(my Courier email address)" || $USER eq "balint")

{

  cc "!(my Exchange email address)"

}
I also added an Exchange recipient policy so that it would only keep the last 30 days of messages, which doubles as a backup of sorts.
Here is a useful page to help with diagnosing problems with Push in Exchange: http://msexchangeteam.com/archive/2006/04/03/424028.aspx
A while ago I started using the Performance Tools that came bundled with Visual Studio 2005 Team Suite to analyse my code. There are two analysis methods: sampling and instrumentation. Although instrumentation has a higher overhead, it can reveal in greater detail exactly what your program is doing. In order for instrumentation to proceed, one must link with the /PROFILE switch and then use VSInstr to insert counters into one’s code. To cut down the cruft collected during a profiling session, one can use the VSInstr switches to dictate exactly which functions should be instrumented and/or use the VSPerf API to command the profiling engine to start/stop/suspend/resume/mark data collection during a run.
One fatal flaw of the Performance Explorer in the 2005 IDE was that one couldn’t start a program with data collection in the stopped state. It would always start collecting data from the very beginning of execution. Visual Studio 2008 includes a command to “Launch with Profiling Paused”, which is a great way to only start profiling when you need to (e.g. via StartProfile or VSInstr /STARTONLY).
Alas, there is still a bug in the Performance Explorer (or, rather, in its build system). If one selects, through the Binary properties of a performance session, to ‘relocate instrumented binaries’, and then proceeds to set ‘additional instrumentation options’ in the Advanced section, the IDE will complain when attempting to start a new profiling session and print this error message in the Output window: “Object reference not set to an instance of an object.”. This is highly annoying because it is helpful to put the instrumented binaries elsewhere (not where the original build outputs reside) AND add specific command line options, such as /VERBOSE and /CONTROL (in conjunction with the others).
I don’t know how to work around this bug; I had hoped it was fixed in 2008, but apparently not. The easiest thing is to not relocate the instrumented binaries. Perhaps one can add another build configuration that includes the /PROFILE linker option and uses its own folder as the build output destination where the binaries can be instrumented in-place.
Here are some helpful resources about using the Performance Tools:
http://blogs.msdn.com/angryrichard/archive/2005/01/16/354194.aspx
http://blogs.msdn.com/scarroll/archive/2005/04/13/407981.aspx
http://blogs.msdn.com/ianhu/archive/2005/06/09/427327.aspx
After upgrading my Drupal site to the latest point release (5.19), before transitioning to version 6, I discovered that the action parameter of all rendered forms were being prefixed a slash ‘/’. This in itself is reasonable since one would expect the REQUEST_URI server variable to return a relative URL. However, as I host several websites, Drupal runs inside its own VHost with URL rewriting to enable short URLs (without the ‘q=’ querystring). If I access Drupal directly via the web server’s address, which maps to the default VHost (this also happens to be Drupal), REQUEST_URI is relative. If I access it via the address externally visible on the web (http://spench.net/) then REQUEST_URI is absolute (i.e. prefixed with the protocol and domain).
The Druapl ‘request_uri’ function in includes/bootstrap.inc always adds a slash to the beginning of the server variable REQUEST_URI, which will break any absolute URLs.
The following modification (the strpos check) resolves this issue:
/**

* Since $_SERVER['REQUEST_URI'] is only available on Apache, we

* generate an equivalent using other environment variables.

*/

function request_uri() {

  if (isset($_SERVER['REQUEST_URI'])) {

    $uri = $_SERVER['REQUEST_URI'];

  }

  else {

    if (isset($_SERVER['argv'])) {

      $uri = $_SERVER['SCRIPT_NAME'] .'?'. $_SERVER['argv'][0];

    }

    else {

      $uri = $_SERVER['SCRIPT_NAME'] .'?'. $_SERVER['QUERY_STRING'];

    }

  }

  if (strpos($uri, '/') == 0)

  {

    // Prevent multiple slashes to avoid cross site requests via the FAPI.

    $uri = '/'. ltrim($uri, '/');

  }

  return $uri;

}
From Wikipedia:
“The mammalian diving reflex optimizes respiration which allows mammals to stay underwater for a long time. It is exhibited strongly in aquatic mammals (seals, otters, dolphins, etc.), but exists in a weaker version in other mammals, including humans. Diving birds, such as penguins, have a similar diving reflex. Every animal’s diving reflex is triggered specifically by cold water contacting the face – water that is warmer than 21 °C (70 °F) does not cause the reflex, and neither does submersion of body parts other than the face. Also, the reflex is always exhibited more dramatically, and thus can grant longer survival, in young individuals.”
Interesting graph of bradycardia in a diving seal.
Something to think about next time you splash some cold water on your face!
When debugging my VC++ projects, I routinely make use of ‘Edit & Continue’ by modifying code in the Visual Studio environment while stepping through the compiled code. Recently I found that typing into a code window would cause Visual Studio to become unresponsive for a long period. Checking Task Manager, I found that WerFault had kicked in and was generating a minidump for DevEnv.exe – Visual Studio was clearly not happy. The unusual thing was that Visual Studio would not immediately terminate after the minidump finished. Instead, it would continue running. However, if I would now close the debugee (my own application), attempt to continue execution with modified source code (which would activate Edit & Continue), or manually stop the debugger, Visual Studio would crash.
After a very thorough search (looking at Visual Studio’s stack trace using symbols from the Microsoft Symbol Store, seeing exceptions thrown from HeapFree and IDebugEncLineMap, un-installing various plugins such as AnkhSVN, and duplicating the tests on another machine), I could not identify the cause. Thinking about any configuration changes I had made in the last months, I tried removing the all additional Include & Library paths I had ever added to the VC++ directory options. These can be found (on Vista) in:
C:\Users\User Name\AppData\Local\Microsoft\Visual Studio\8.0\VCComponents.dat
Voila! No more crashes! As it turned out, I had added so many extra Include/Library directories (each with a long path) that some portion of the debugger would crash when reproducing the steps described above. Perhaps this is a buffer overflow? I had a look through the patch listing on Microsoft Connect, but found nothing matching this problem.
Now, I wanted to have my cake and eat it too: I resolved this issue, while keeping all of my configured Include/Library directories, by creating a hard-link (or NTFS reparse point) to the base of my SDK directory (under which all of the Include/Library directories reside) further up the directory chain, in effect shortening the path lengths.
For example, here are two Include directories:
C:\Documents and Settings\User Name\My Documents\Visual Studio 2005\Projects\_SDK\Some Code\include

C:\Documents and Settings\User Name\My Documents\Visual Studio 2005\Projects\_SDK\Other Code\include
Lots of these will crash Visual Studio.
They both share the parent: C:\Documents and Settings\User Name\My Documents\Visual Studio 2005\Projects\_SDK
So create a reparse point at: C:\Dev\SDK And make it point to the parent above.
So now in Visual Studio, you can change the original Include directories to:
C:\Dev\SDK\Some Code\include

C:\Dev\SDK\Other Code\include
In total, they are of a much shorter length and fall under the mysterious buffer limit, thereby avoiding the dreaded crash scenario.
NTFS soft/hard-links can be made using the command-line tools at the bottom of this handy page.
While working on a Flash project in Adobe Creative Suite CS4, I was editing some ActionScript 2.0 code (AS) stored in a separate code file from the main Flash document (FLA). I decided to revert to an older version of the whole project, thereby going back to FLA and AS files with an older timestamp. Publishing the document proceeded as normal, however when I went to preview it I found behaviour that would indicate that the newer AS code was still being compiled, even though I had gone back to using old code. After using Process Monitor and highlighting the code file in question, I discovered Flash caches compiled classes (to ASO files) in a special directory (under Windows Vista):
C:\Users\User Name\AppData\Local\Adobe\Flash CS4\en\Configuration\Classes\aso\...
I suspect under previous versions of Windows, it would be the same directory structure under:
C:\Documents and Settings\User Name\Application Data or
C:\Documents and Settings\User Name\Local Settings (If you know, please leave a comment!)
I guess that as the old AS code file had a timestamp older than the cached ASO file, the cache was not refreshed and the original code was used.
There are two options: delete the ASO files, or ‘touch’ the necessary AS files with a newer file time.
Please visit this page to view the video clip.
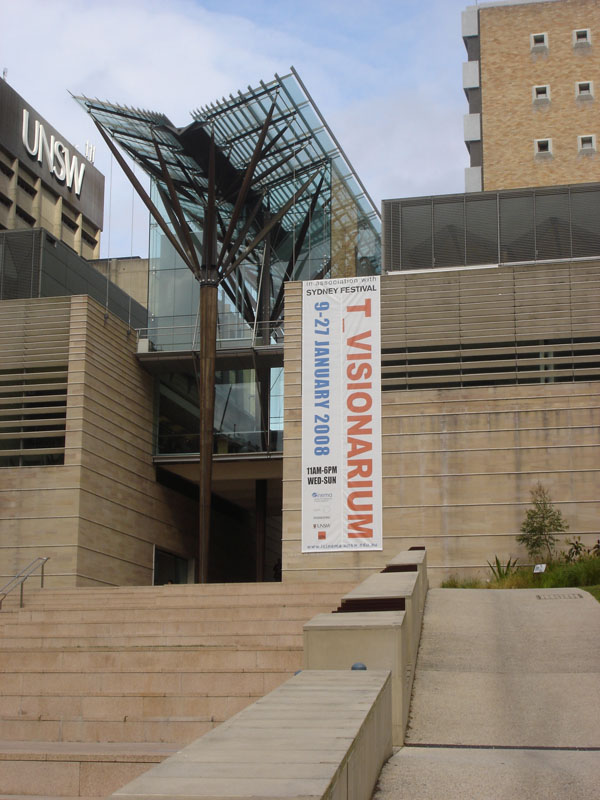
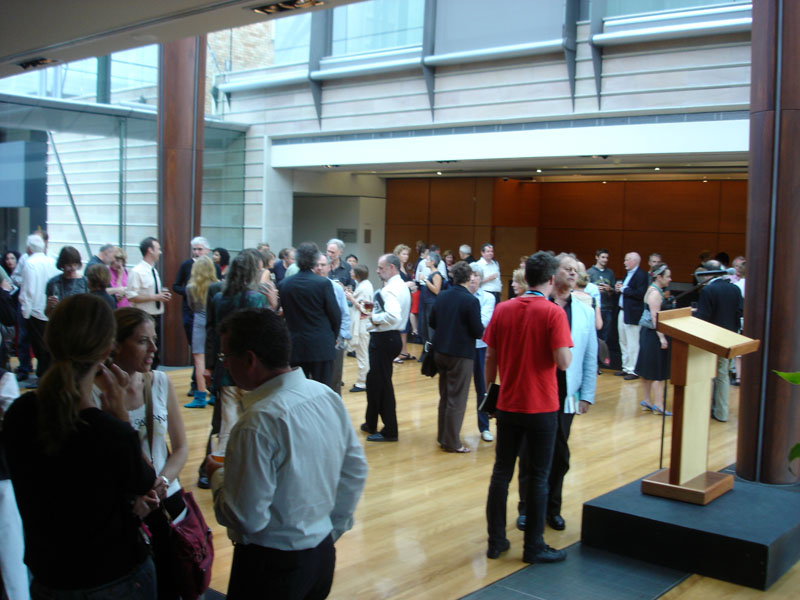
TVisionarium (AKA T_Visionarium Mk II, affectionately TVis) was officially launched yesterday in The Scientia at the University of New South Wales. Bruce Beresford was invited to open it. Jill Bennett published a book about it: “T_Visionarium: A User’s Guide” (albeit not the technical one you might expect). I received a nice credit at the back of the publication (as well as in this academic one on AVIE). The project itself also has its own Wikipedia page. It will be open for public viewing as part of the 2008 Sydney Festival for three weeks. If you want to have your brains blown out by an extraordinary sensory experience, then definitely come along.
The TVisionarium Sydney Festival banner:
TVisionarium (AKA T_Visionarium Mk II, affectionately TVis) has made it into next year’s Sydney Festival!


© 2007 Balint's Blog. Powered by Wordpress wearing MyJournal Hypereal by  BlogoSquare
There are currently 37 posts extending over 0 categories with loads upto 8 comments with valid XHTML and CSS.


